
LeukoComplete™ Gene Detection Kit for human IL4
Canon Medical Diagnostics
- Catalog No.:
- MIN-11150-HT-004


- Shipping:
- Calculated at Checkout
$285.00
Related Products
Product Description
Primer and Enzyme for real-time PCR.
LeukoComplete™ Cellular Immunity Detection Kit
This is a unique research test kit that adds antigens such as viral fragment peptides to a small amount of whole blood and combines it with a dedicated plate to evaluate changes in gene expression in stimulated specific T cells as a cellular immune response using quantitative PCR.
Features
This kit is for preparing genes derived from immune cells, including T cells, from samples containing white blood cells. This kit allows for easy extraction and purification of mRNA from white blood cells in a sample, and synthesis of cDNA by reverse transcription of the purified mRNA. The synthesized cDNA can be used to evaluate relative changes in gene expression by quantitative PCR. This kit is suitable for performing the Ex vivo Activation of Gene in Leukocyte (EAGL) method, a cellular immunity evaluation method based on gene detection. Two uniquely designed plates, the "Leukocyte Isolation Plate" and the "mRNA Capture Plate," achieve high reproducibility and throughput.
Specifications
| Applications | Assessment of cellular immune responses Detection of cytokine-related genes |
| Work time | 180 minutes + antigen stimulation time |
| Sample Type | Fresh blood (human, mouse) |
| PBMC (human, mouse) | |
| Spleen (mouse) | |
| Final product | 30µl cDNA |
| Detection target | Control genes (human, mouse) ACTB, GAPDH, B2M |
| Target gene (human) IFNG, IL-2, TNFSF2, IL-6, IL-10, GM-CSF, CXCL10, IL-4, IL-5 |
|
| Target gene (mouse) IFNG, IL-10, IL-17 |
|
| Measuring Equipment | Real-time PCR equipment Digital PCR Instrument |
| Application | T cell antigen screening Confirmation of vaccine efficacy Assessment of allergic reactions |
LeukoComplete™ Plate and RT Kit (Catalog number: MIN-11130)
| Components | Size |
|---|---|
| PT Buffer | 15mL x 1 bottle |
| Leukocyte Isolation Plate (Filter Plate) | 1 sheet |
| Deep Well Plate | 1 sheet |
| Proteinase K | 30 µL x 1 |
| TCEP | 300 µL x 1 |
| Lysis Buffer | 6 mL x 1 bottle |
| mRNA Capture Plate | 1 sheet |
| Wash Buffer A | 30mL x 1 bottle |
| Wash Buffer B | 50 mL x 1 bottle |
| Aluminum Seal | 1 sheet |
| M-MLV Reverse Transcriptase | 40 µL x 1 |
| RNase Inhibitor | 10 µL x 1 |
| RT Buffer | 1.5 mL x 2 |
LeukoComplete™ Antigen Coated Plate (Catalog number: MIN-11140) *1
| Components | Size |
|---|---|
| Antigen Coated Plate for SARS-CoV-2 *1 | 1 sheet (24 tests) |
*1 Overlapping peptides (15 amino acids, 11 overlaps) derived from the SARS-CoV-2 spike protein are applied as antigens. One test consists of four wells: a blank, two antigens, and a positive control.
LeukoComplete™ Gene Detection Kit *2
| Components | Size |
|---|---|
| Primer Mix ※2 | 100 µL x 1 |
| PCR Enzyme Mix | 500 µL x 1 |
*2 The part number and included Primer Mix vary depending on the gene of interest.
Product data
Gene extraction performance
- Relationship between the amount of each sample (human blood, human PBMC, mouse blood, mouse spleen) added and the expression level of the control gene -
Figure 1. Human blood and mouse blood were 50 mL, and human PBMC and mouse spleen were serially diluted in two-fold increments starting from 5 x 10⁵ cells , and mRNA from leukocytes was extracted/cDNA was synthesized using LeukoComplete™. Housekeeping genes were measured by real-time PCR using the synthesized cDNA as a template. For all sample types, genes were extracted with high linearity (R2 > 0.9) using LeukoComplete™.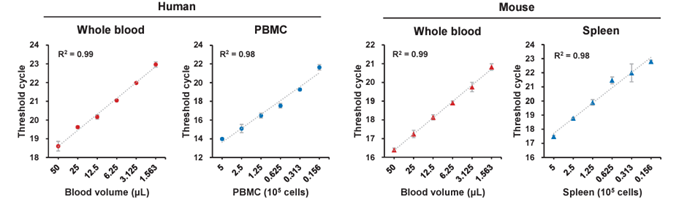
Examples of target genes
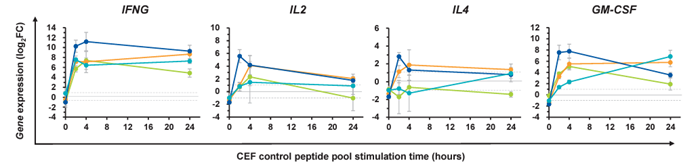
- Analysis of the expression changes of immune-related genes (IFNG, IL2, IL4, GM-CSF) according to the time of antigen stimulation -
Figure 2. 100 µL of fresh human blood was mixed with CEF peptide pool or PBS, and after incubation at 37°C for 0 to 24 hours, the blood was frozen and stored. After thawing the blood, genes were extracted using LeukoComplete™ and the expression changes of various genes were calculated (each colored line represents the results of a different donor (n=4)). log 2 FC = - (Ct value of target gene [with antigen stimulation] - Ct value of control gene [with antigen stimulation]) - (Ct value of target gene [without antigen stimulation] - Ct value of control gene [without antigen stimulation])
Comparison of cell-mediated immunity assessment methods
- Comparison with ELISpot and ICS (Intra Cellular Staining) methods using the same specimens -
Figure 3. Fresh blood or PBMCs from 21 COVID-19 vaccine recipients were used to evaluate the cellular immune response to overlapping peptides of the SARS-CoV-2 spike protein. LeukoComplete™ measured IFN-γ gene (IFNG), ELISpot measured IFN-g, and ICS measured CD3-positive IFN-g-secreting cells. The measured values for both evaluation methods were around R=0.5, suggesting that the cellular immune evaluation method based on gene detection using LeukoComplete™ can perform evaluations similar to existing methods. LeukoComplete™ had a higher number of samples above the cutoff than the ICS method, suggesting high sensitivity (same number as the ELISpot method).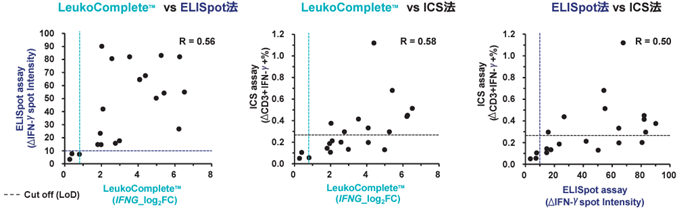
Analysis method example
- Comparative Ct method: Evaluation of relative IFN-g gene fluctuations with and without antigen stimulation -
Figure 4. Normalization of expression levels by the control gene enabled relative comparison of genetic fluctuations between wells. ΔΔCt (log 2 Fold Change) = - (Ct value of target gene [with antigen stimulation] - Ct value of control gene [with antigen stimulation])
- (Ct value of target gene [without antigen stimulation] - Ct value of control gene [without antigen stimulation])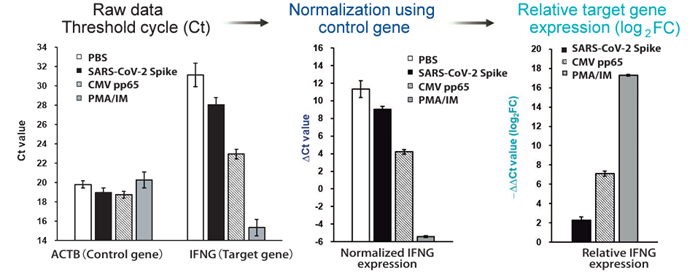
Evaluation conditions for target genes
| Species | Genes | Positive control antigen | Cutoff of Ct | |||||
| PMA/IM | PHA | LPS | ConA | CEF | ||||
| Human | IFNG | +++ | ++ | +++ | ++ | + | 32 > | |
| IL2 | +++ | ++ | +/- | +/- | N.D. | 34 > | ||
| TNFSF2 | ++ | + | ++ | + | +/- | 32 > | ||
| IL4 | +++ | ++ | N.D. | N.D. | N.D. | 34 > | ||
| IL5 | ++ | +/- | N.D. | N.D. | N.D. | 34 > | ||
| IL6 | ++ | ++ | +++ | ++ | N.D. | 34 > | ||
| IL10 | ++ | + | ++ | +/- | N.D. | 34 > | ||
| IL13 | +++ | ++ | +/- | +/- | N.D. | 34 > | ||
| CSF2 | +++ | ++ | ++ | ++ | N.D. | 32 > | ||
| CXCL 10 | N.D. | ++ | ++ | ++ | ++ | 32 > | ||
| Mouse | IFNG | +++ | +/- | +/- | ++ | - | - | |
| IL 10 | +++ | ++ | N.D. | ++ | - | - | ||
| IL 17 | ++ | N.D. | +/- | N.D. | - | - | ||
| Final conc. of each positive control |
PMA: 100 ng/mL IM: 1000 ng/mL |
10-100 µg/mL | 1-100 µg/mL | 100 µg/mL | 1-10 µg/mL | Instrument: ABI Fast7500 Threshold line: 0.1 |
||
Human: 100 mL of fresh blood was mixed with each antigen and incubated for 4 hr under 37℃.
Mouse: 106 cells of spleen was mixed with each antigen and incubated for 4 hr under 37℃.
*Please contact us if you require primers for genes not listed.
| Reagent | Abbreviation |
|---|---|
| PMA | Phorbol 12-myristate 13-acetate |
| IM | Ionomycin |
| PHA | Phytohemagglutinin |
| LPS | Lipopolysaccharide |
| ConA | Concanavalin A |
| CEF | CEF control peptide pool |
| Rank | Mean Relative mRNA Expression (log₂FC, n=12) |
|---|---|
| +++ | > 8 |
| ++ | 5-8 |
| + | 3-5 |
| +/- | 1.5-3 |
| N.D. | < 1.5 |
| - | Not evaluated |
This product is a "research reagent." Please be careful not to use it for medical or clinical diagnostic purposes in humans or animals, or for food use
| Product Specifications | |
| Reactivity | Human |
| Documents & Links for LeukoComplete™ Gene Detection Kit for human IL4 | |
| Manual | LeukoComplete™ Gene Detection Kit for human IL4 Manual |
| Flyer | LeukoComplete™ Gene Detection Kit for human IL4 Flyer |
| Documents & Links for LeukoComplete™ Gene Detection Kit for human IL4 | |
| Manual | LeukoComplete™ Gene Detection Kit for human IL4 Manual |
| Flyer | LeukoComplete™ Gene Detection Kit for human IL4 Flyer |
| Citations for LeukoComplete™ Gene Detection Kit for human IL4 – 4 Found |
| Mitsuhashi M, Tomozawa S, Endo K, Shinagawa A.. Quantification of mRNA in whole blood by assessing recovery of RNA and efficiency of cDNA synthesis. Clin Chem. 2006;52(4):634-42. PubMed |
| Mitsuhashi M. . Ex vivo simulation of leukocyte function: stimulation of specific subset of leukocytes in whole blood followed by the measurement of function-associated mRNAs. J Immunol Methods. 2010;363(1):95-100. PubMed |
| Saito et al . Rapid and high throughput assessment of cellular immunity against SARS-CoV-2 based on the ex vivo activation of genes in leukocyte assay with whole blood. Biochemical and Biophysical Research Communications. 2023;:694:149398. PubMed |
| Saito et al. Longitudinal monitoring of cellular immunity by the ex vivo activation of genes in leukocytes (EAGL) assay highlights potential markers of mRNA COVID-19 vaccine efficacy against breakthrough symptoms. Vaccine. 2025;:68:127942. PubMed |